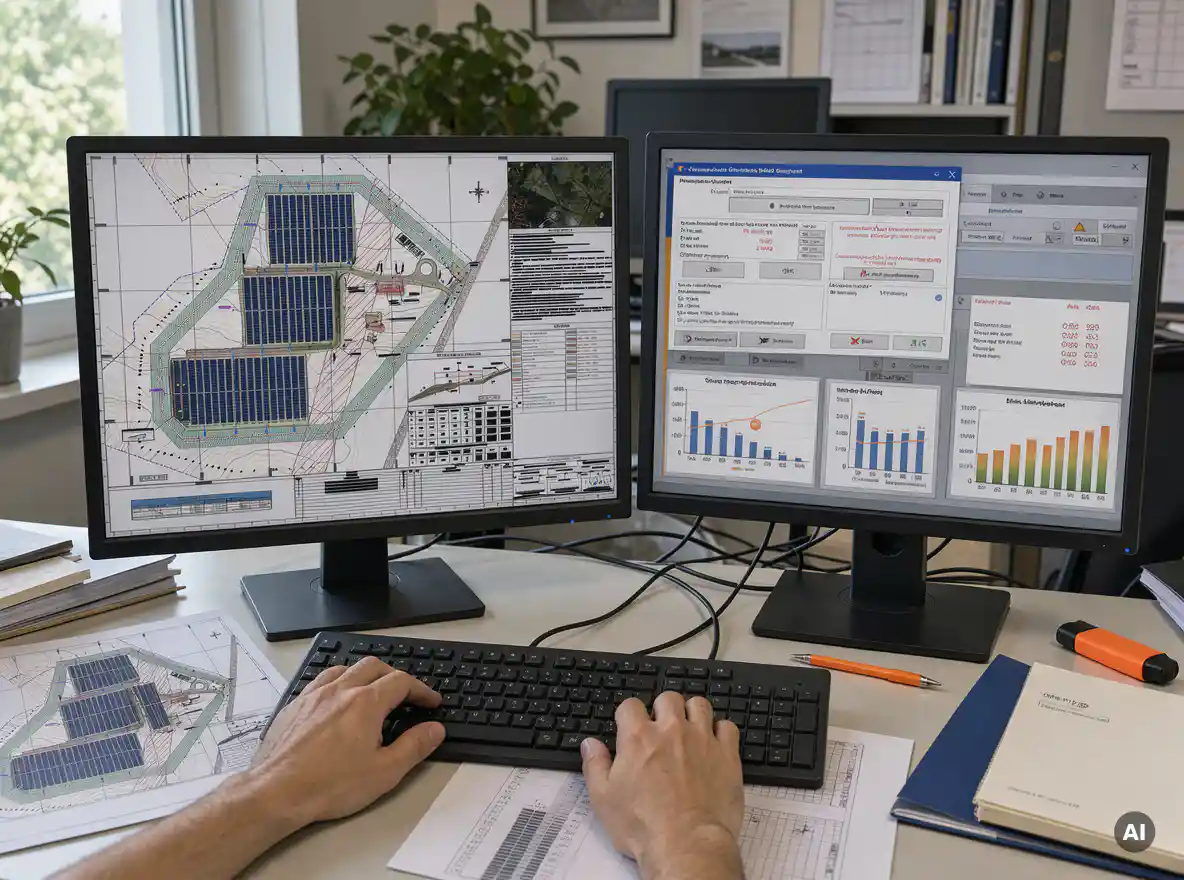
To check a solar panel layout design against PVsyst results, match the physical inputs first (module, tilt, azimuth, row pitch, DC capacity), then compare the outputs: installed kWp, shading loss, and annual yield. If inputs are identical and results still diverge beyond a small tolerance, the cause is almost always a modeling assumption, not an error in the layout.
Most mismatches come from how the geometry is translated into PVsyst’s 3D scene and shading model. The sections below show which inputs to lock, how to compare numbers, and when to re-validate.
Which layout inputs must match your PVsyst project?
The layout inputs that must match are module model and dimensions, total module count, tilt, azimuth, row spacing (pitch), table configuration, inverter and string arrangement, and site coordinates with terrain. If any of these differ, your PVsyst yield and your layout’s shading results are not comparable.
Before comparing a single result, build a short input checklist and confirm each item on both sides:
Module data: the same manufacturer file, power class, dimensions, and orientation (portrait or landscape).
Array geometry: tilt, azimuth, pitch, table size, and the number of modules per table.
Electrical configuration: modules per string, strings per inverter, and the resulting DC/AC ratio.
Site data: latitude, longitude, altitude, meteorological dataset, and the terrain slope used in the layout.
Obstacles: nearby buildings, trees, fences, and rooftop equipment that cast shadows.
Tiny differences add up. A module that is 10 mm taller in one file changes row spacing and, with it, the shading profile. Treat your solar panel layout design as the single source of truth and make PVsyst follow it, not the other way around.
How do you compare layout and PVsyst numbers step by step?
Compare in a fixed order: installed capacity first, then geometry, then shading, then energy yield. Each step isolates a different source of error, so you can trace any gap to its cause instead of guessing at the final kWh figure.
Verify DC capacity. Multiply module count by module wattage in your layout, then confirm the same kWp appears in PVsyst. A mismatch here invalidates everything downstream.
Check geometry. Confirm tilt, azimuth, and pitch match. Compare the ground coverage ratio (GCR) from the layout with the one PVsyst derives from its scene.
Compare shading factors. Look at near-shading loss and the electrical shading effect in PVsyst against your layout’s shading analysis for the same days and times.
Compare system losses. Align assumptions for soiling, mismatch, wiring, and availability so you are not attributing a loss difference to the layout.
Compare annual yield. Only now compare specific yield (kWh/kWp) and performance ratio.
Document each step in a short validation sheet. When a reviewer asks six months later why the numbers differ by 1.2%, you will have the answer ready.
Why do layout shading losses differ from PVsyst?
Layout shading losses differ from PVsyst mainly because each tool models shading differently. PVsyst simulates hourly shadows and applies an electrical shading model based on string and cell layout, while a layout tool may calculate geometric shadow coverage or use simplified assumptions. Terrain, obstacles, and time resolution widen the gap.
Common causes include:
Different shading models: geometric shading (area covered) versus electrical shading (how partial shade cuts string output through bypass diodes).
Simplified 3D scenes: PVsyst scenes are often built by hand, so slopes, uneven terrain, and small obstacles may be missing or approximated.
Time resolution: coarse sun-position sampling in one tool misses low-sun hours where row-to-row shading peaks.
Module orientation and string layout: portrait versus landscape and string routing change how many strings are hit by the same shadow.
If shading is the largest gap, rebuild the PVsyst scene from the exact layout geometry and re-run. Most of the difference typically disappears once both tools see the same obstacles and terrain.
What deviation from PVsyst is acceptable?
There is no universal standard, but many engineering teams treat roughly 1 to 2% on annual specific yield as a comfortable tolerance when inputs are identical. Larger gaps usually signal an input mismatch, a different loss assumption, or a scene error that deserves investigation before the design is released.
Your acceptable range should be defined by project context, not a single number:
Bankable or financed projects: aim for the tightest agreement, and always reconcile the remaining difference in writing.
Early-stage design: a wider band is reasonable because layouts are still changing.
Complex terrain or heavy shading: expect larger deviations because both models carry more uncertainty.
The key is consistency. Agree on a tolerance with your team and client, record it in your design procedure, and apply it to every project. A deviation you can explain is far better than a perfect match you cannot trace.
How do design changes affect PVsyst re-validation?
Any change that alters DC capacity, geometry, shading, or electrical configuration requires re-validating the PVsyst model. Swapping a module, adjusting tilt, moving a table, or changing string length all shift yield, so the PVsyst project and the layout must be updated together and compared again.
Not every change carries equal weight. Use this as a practical guide:
Always re-validate: module swap, tilt or azimuth change, pitch change, added or removed tables, new obstacles, inverter or string changes.
Usually re-validate: cable route changes that affect ohmic losses, or moving the inverter location.
Rarely re-validate: purely documentation changes such as drawing labels or title blocks.
The real cost is the rework cycle. When module specifications change, every downstream calculation and the PVsyst scene need to follow. Keeping a version log that ties each layout revision to a PVsyst project version prevents the common problem of simulating one design and building another.
Can CAD-based PV design tools automate PVsyst checks?
Yes. CAD-based PV design tools can automate much of the check by generating the layout, string plan, and shading analysis from a single model, then exporting data in a form PVsyst can use. This removes manual re-entry, which is where most mismatches start.
For engineers who already work in AutoCAD or BricsCAD, this means the geometry in the drawing and the geometry in the simulation come from the same source. At
Virto Solar, we built Virto.CAD as a plugin for exactly this workflow. It automates string planning, shading analysis, and bill of materials generation inside the CAD environment, and it is designed for PVsyst compatibility so layout changes carry through to your validation without rebuilding everything by hand. In one documented project in Belgium, this approach cut design time by 80%.
Automation does not replace engineering judgment. You still decide the tolerance, review the shading assumptions, and sign off the results. What it removes is the repetitive copying that introduces errors. If you want to see how this fits your validation process, you can
get in touch with us and we will walk through it with you.
In short, validating a solar panel layout design against PVsyst is a matter of matching inputs, comparing in a fixed order, understanding where shading models diverge, and re-checking after every meaningful change. Build that routine once and it will save you time on every project in 2026 and beyond.
Frequently Asked Questions
How do I get started with validating my layout against PVsyst if I've never done it before?
Start by creating a one-page input checklist covering module file, tilt, azimuth, pitch, table size, string configuration, and site coordinates. Export or copy those values from your layout, enter them in PVsyst, and run a baseline simulation with minimal shading. Once installed kWp and geometry match, add obstacles and terrain step by step so you can see which change causes any divergence.
My installed kWp matches, but annual yield still differs by more than 2%. Where should I look first?
Check loss assumptions before blaming the layout. Soiling, mismatch, wiring losses, availability, and the meteorological dataset are the most common hidden differences. If those are aligned, compare the near-shading and electrical shading losses next, since the shading model is the most frequent source of residual gaps.
How do I rebuild the PVsyst 3D scene so it accurately reflects my layout?
Use exact table dimensions, pitch, tilt, and orientation from your layout drawing rather than approximating them by eye. Import or recreate obstacles such as buildings, trees, and rooftop equipment with real heights, and include terrain slope if the site is not flat. After building the scene, compare the ground coverage ratio PVsyst reports against the one in your layout as a quick sanity check.
What if my site has sloped or uneven terrain?
Sloped terrain is one of the biggest sources of mismatch because simplified PVsyst scenes often assume flat ground. Model the slope explicitly, or split the site into zones with their own tilt, pitch, and orientation parameters. Also expect a wider tolerance on yield deviation and document the assumptions you made for each zone.
What are the most common mistakes when comparing a layout to PVsyst results?
The most frequent mistakes are comparing results before confirming DC capacity, using slightly different module files, forgetting to match portrait versus landscape orientation, and treating geometric shading as equal to electrical shading. Another common error is updating the layout without updating the PVsyst project, so you end up simulating one design and building another. A version log tying each layout revision to a PVsyst project version prevents this.
Should I compare hourly results or just annual totals?
Annual totals are fine for a final sign-off, but hourly or monthly comparisons are much better for troubleshooting. Look at low-sun hours in winter and early morning or late afternoon, when row-to-row shading peaks, to see whether the shading model is the cause. If monthly yields diverge mainly in winter, the issue is typically pitch, tilt, or obstacle modeling rather than loss assumptions.
How should I document the validation so it holds up in a client or lender review?
Keep a short validation sheet that lists inputs on both sides, the comparison order (capacity, geometry, shading, losses, yield), the agreed tolerance, and an explanation for any remaining difference. Reference the PVsyst project version and layout revision used. For financed projects, reconcile every deviation in writing so a reviewer can trace it without re-running the simulation.
Related Articles
This content was generated with the help of AI — it may contain mistakes