


From sunlight to socket: every loss in a solar yield, checked against PVsyst
What if the biggest loss in your solar yield isn’t in the panels at all, but in the mountains around them? Most yield estimates hide that kind of detail behind a single “system losses” percentage, and that’s where costly surprises start. We opened up the full loss chain, step by step, and checked every line against PVsyst.
Take a 583 kWp flat-roof plant near Mürren, at 848 m in a deep Alpine valley in Switzerland. Simulate it on an open plain and it produces 732 MWh a year. Simulate it where it actually stands, surrounded by mountains, and it produces 455 MWh. One line in the loss chain, far shading, takes 38 % of the energy.
That is why a yield estimate is not one number with a “system losses” percentage on top. It is a chain of physical steps, from sunlight on the ground to AC at the inverter, and every site has its own weak link.
This post walks through that chain as our yield engine calculates it. For each step we show the country where it matters most, using nine reference projects from Belgium to the Philippines. And because a yield number is only useful if you can trust it, we put every one of those projects side by side with PVsyst, the industry reference. Across 23 simulations our inverter output lands within 1.4 % of PVsyst, and up to the inverter, within 0.3 %.
What is a loss chain?
A loss chain follows the energy from the sunlight that falls on flat ground to the AC power that leaves the inverter. Each step gains or loses a few percent, and each step works on what the previous one left. PVsyst users know it as the loss diagram; we report the same
lines, in the same order, for every simulation.
Here is the full chain for our most ordinary reference project: a 162 kWp roof in Belgium, tilted 10° to the south, on 125 kWac of inverters.
| Step | PVsyst | Our engine |
|---|---|---|
| Sunlight on flat ground (GlobHor) | 1,133.6 kWh/m2 | 1,133.3 kWh/m2 |
| Tilting the panels (transposition) | +7.50 % | +7.62 % |
| Soiling | −1.00 % | −1.00 % |
| Reflection off the glass (IAM) | −3.23 % | −3.36 % |
| Low light (irradiance level) | −1.31 % | −1.32 % |
| Temperature | −4.31 % | −4.40 % |
| Module quality | +0.33 % | +0.32 % |
| Light-induced degradation (LID) | −1.70 % | −1.70 % |
| Mismatch | −2.05 % | −2.05 % |
| DC cabling | −1.07 % | −1.00 % |
| Inverter efficiency | −2.16 % | −2.44 % |
| Inverter power limit (clipping) | −0.07 % | −0.07 % |
| Energy at inverter output | 167.1 MWh | 166.5 MWh |
In Belgium no single line dominates; the losses add up to about 15 % between the light on the tilted panels and the inverter output. Move the same chain to another country, and one line takes over.
How much light reaches the panels?
The chain starts with weather: hourly sunlight, split into direct and diffuse, plus air temperature and wind. We take it from satellite and reanalysis databases such as PVGIS SARAH-3 and ERA5 in Europe, Africa and Asia, and NSRDB in the United States, or from a weather file you upload.
From the sun’s position at every hour, the engine converts the light on flat ground into the light on your tilted panels. This is transposition, and we use the Perez model, the same family PVsyst uses. Tilting toward the sun usually gains energy: +7.5 % in Belgium, +30 % for panels at 45° in Norway, where the sun stays low.
The Perez model does not treat the sky as one even dome. It splits the light on the panels into five parts: the direct sunbeam, a bright ring around the sun, an even sky background, a brighter band near the horizon, and light reflected from the ground. Each part is tilted with its own geometry, and how bright the ring and the band are depends on the sky
conditions hour by hour.
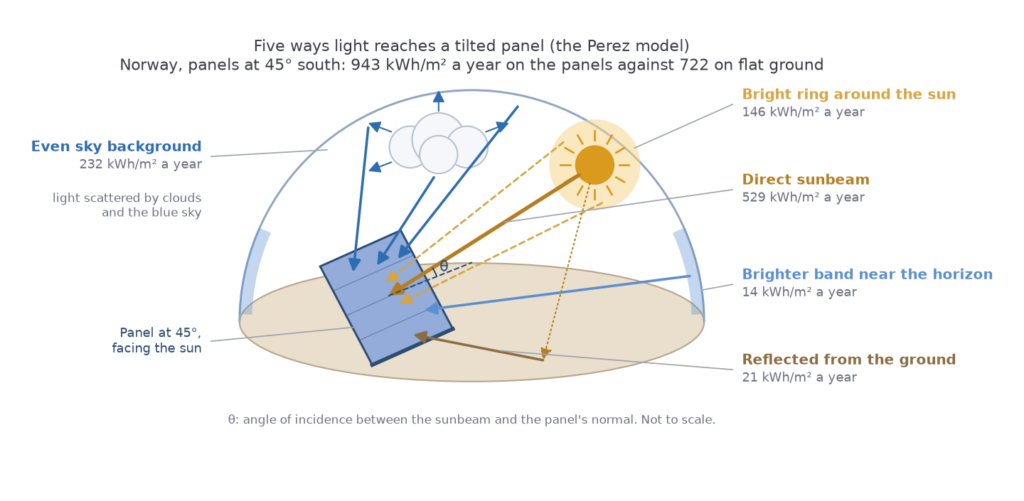
In Norway, at 45°, that turns 722 kWh/m2 on flat ground into 943 kWh/m2 on the panels: +30.5 % in our engine, +30.3 % in PVsyst. In March the tilted panels see twice the light of flat ground.
Ecuador: when tilting costs energy
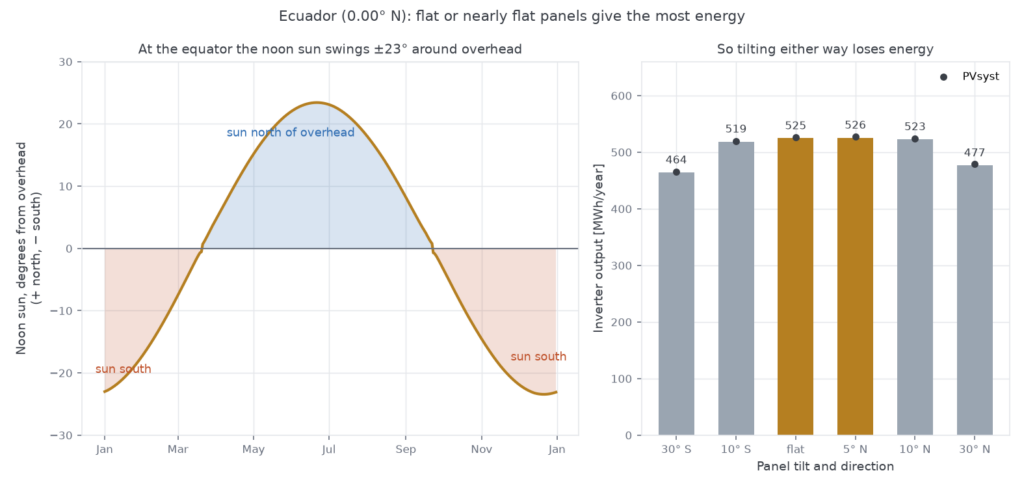
On the equator the rule flips. The noon sun swings 23° north of overhead in June and 23° south in December, so a panel tilted either way faces away from the sun for half the year. We simulated the same 392 kWp plant in Ecuador with six orientations. Flat and 5° north both give about 525 MWh a year. At 30° the plant loses 9 % facing north and 12 % facing south. PVsyst agrees on every variant within 0.7 %.
Switzerland: when the mountains switch off the sun
After transposition comes far shading: the horizon line of mountains, hills or distant buildings. Whenever the sun stands below that line, the direct beam is gone and only diffuse light is left.
At our Swiss site the horizon averages 34°. The figure below shows the sun’s path for seven dates over the year against that horizon. In December the sun clears the mountains for about an hour around noon. Even in June it only rises above the eastern ridge around 9h and disappears behind the western ridge around 15h.
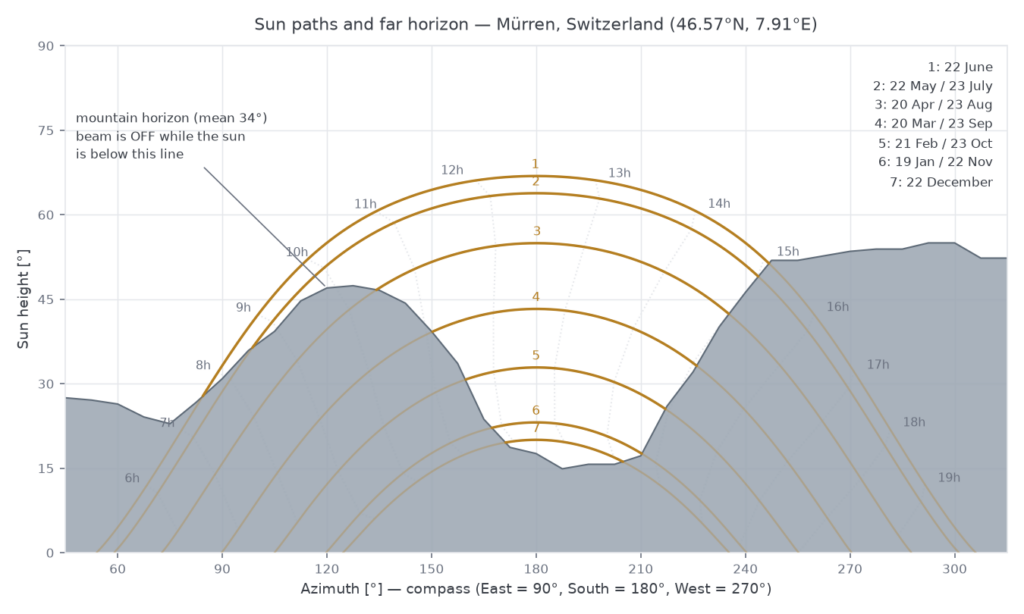
The result is the 38 % loss from the introduction: −37.8 % in our engine, −38.0 % in PVsyst. In winter months the horizon takes close to half of the light. We read the horizon automatically from the terrain data for any location, or you can supply your own.
What happens before light becomes electricity?
Not all light that reaches the panel gets into the cell. Three steps take their share first.
- Reflection (IAM). Glass reflects more as the light comes in at a steeper angle. We calculate it from the physics of the module’s front glass, with or without anti-reflective coating, or from the angle table in the module’s PAN file. It costs 3.4 % in Belgium and 5.4 % in Norway, where the sun is low for much of the year.
- Soiling. Dust, pollen and bird droppings block part of the light. We apply it as a constant factor that depends on the mounting: 1 % on roofs, 3 % on ground-mounted systems and carports, unless you set your own value.
- Colour of the light (spectrum). Sunlight is a mix of colours, and the mix changes during the day. When the sun is low, its light travels through more air and turns redder. Humid air absorbs part of the infrared. A module’s rating is measured under one standard mix, but every cell technology uses its own range of colours. Crystalline silicon uses almost all of them, from blue to infrared, so these shifts barely matter. On humid days the air removes infrared it could not use anyway, so the module does slightly better than its rating. With a low sun in dry air it does slightly worse. Over the seasons that swings by a few percent, so for thin-film modules (CdTe and CIGS) we correct for it every hour, from the sun’s height and the water vapour in the air.
What is left is the effective irradiance: the light that the cells can actually convert.
Why does temperature matter so much?
A module’s nameplate power is measured at a cell temperature of 25 °C. In the sun, cells run much hotter, and a crystalline silicon module loses roughly 0.3–0.4 % of its power for every degree above 25 °C.
We calculate the cell temperature every hour from the irradiance, the air temperature, the wind and how well the mounting lets heat escape: a free-standing rack cools better than a module flat on a roof. That temperature then goes into a single-diode model of the module, built from its datasheet or PAN file, which gives the power at its maximum power point.
Norway against the Philippines
Two of our reference sites show the extremes. In Norway the cells spend most of the year below 25 °C, so temperature is a gain: +2.2 % over the year, and up to 9 % in the cold months. In the Philippines it is a loss in every month of the year, between 10 % and 15 %, −12.5 % over the year. PVsyst gives +2.2 % and −12.3 %.
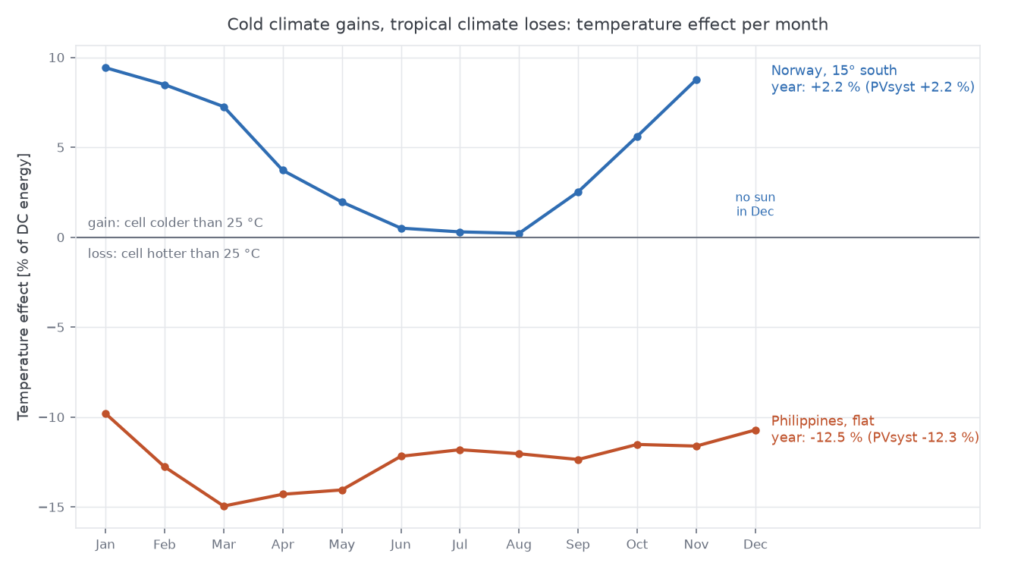
The same physics explains why hot, sunny sites do not always deliver what their sunshine
promises: Spain loses 9.7 % and Egypt 5.9 % to temperature.
The rest of the DC side
A few smaller steps complete the DC energy:
- Low light. Modules are slightly less efficient in weak light: −2.2 % in cloudy Norway, −0.3 % in Egypt.
- Module quality and LID. The real power of the modules against their label, and the light-induced degradation in the first hours of operation (typically 1.5–2 % for crystalline silicon, none for heterojunction or CdTe).
- Mismatch. Modules in a string are never perfectly identical; the weakest sets the pace. Typically about 2 %. DC cabling. Resistive losses in the cables to the inverter, about 1 %. They grow with the square of the current, so they hit hardest at midday.
What does the inverter take?
The inverter turns DC into AC, and it takes two kinds of losses: its own efficiency, typically 1–3 % over a year, and everything that falls outside its operating window. We check every hour against the inverter’s limits on power, current and voltage, and against its start-up threshold.
Egypt: the cost of oversizing
The limit that matters most in practice is AC power. Designers often install more DC power than AC power, because the panels rarely produce their full rating and a smaller inverter is cheaper. The price is clipping: on the sunniest hours the inverter caps its output and the extra energy is lost.
Our Egyptian reference site, with 2,417 kWh/m2 of sunlight a year, shows how far that can go. With 454 kWp on 350 kWac the inverter clips 3.1 % of the energy. With 605 kWp on the same inverters it clips 17.5 %: on a clear June day the output runs flat at its limit from 10h to 15h. PVsyst gives 3.6 % and 18.5 %.
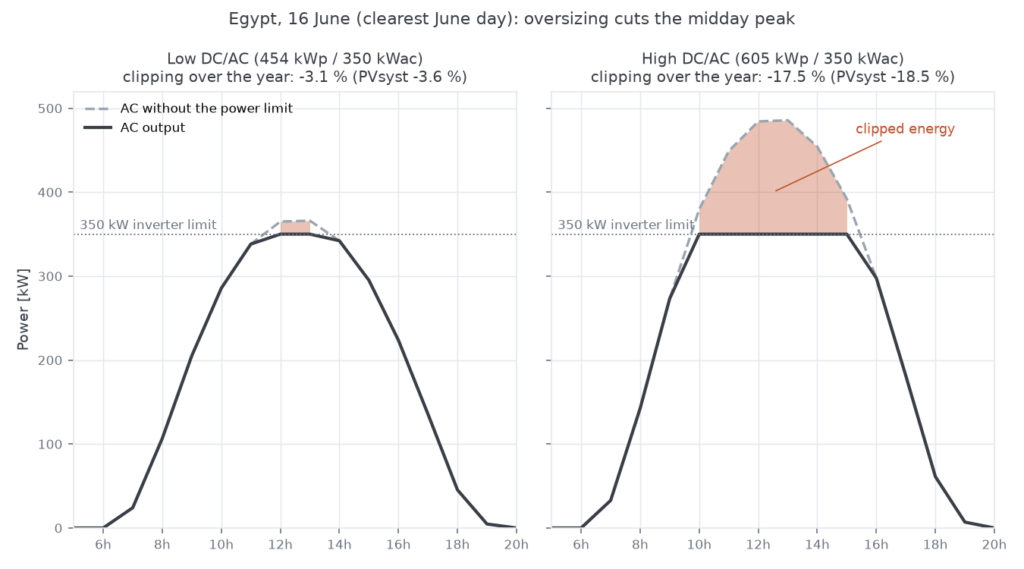
The larger array still produces more in total, 1,078 MWh against 953 MWh, which is exactly the trade-off a designer needs to see: 33 % more panels for 13 % more energy. The loss chain makes that trade-off visible instead of hiding it in one ratio.
After the inverter, the AC energy is ready for the grid. The cable from the inverter to the
grid connection and the inverter’s consumption at night take another 0.5 % or so; we do
not model those yet, so our results stop at the inverter output.
How close are we to PVsyst?
Within 1.4 % at the inverter output on all 23 simulations, and within 1 % on 20 of them. Up to the inverter, every stage lands within 0.3 %.
To check ourselves we built nine projects in PVsyst 8.1.4 (8.1.7 for Spain), from Norway to the equator, with 23 variants between them: different tilts, horizon on and off, two inverter sizings, one and two roof orientations. Then we ran the same projects through our engine with the same inputs:
- the same hourly weather (PVGIS SARAH-3 or ERA5 for 2023), so the comparison tests
- the model and not the weather data;
- the same module and inverter files (PAN and OND);
- the same loss settings, checked automatically against each PVsyst report before every run.
We compare every line of the loss diagram and every month, and rerun the full
comparison whenever the engine changes.
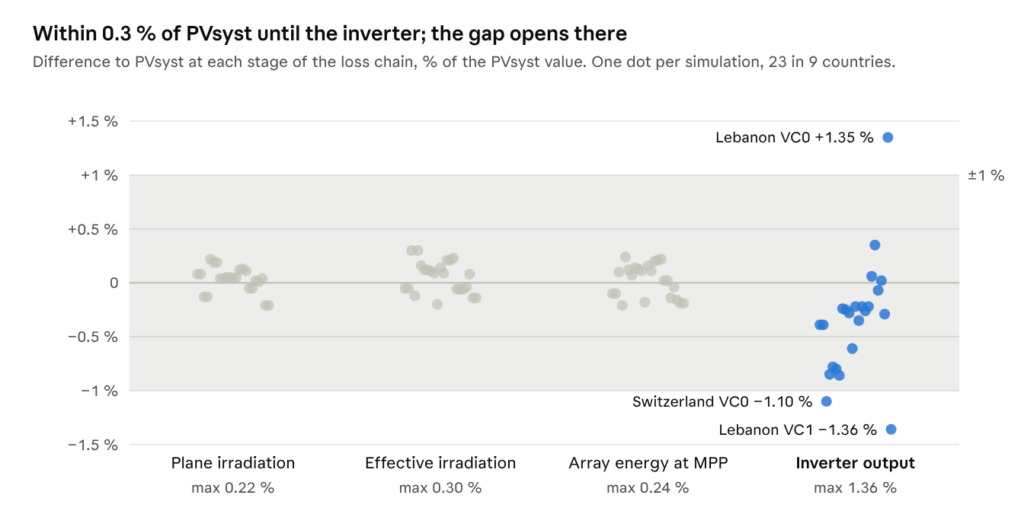
The light model matches closely: transposition, far shading, reflection, soiling and the module’s DC output all land within a few tenths of a percent. The remaining gap opens at the inverter, and we would rather explain it than hide it:
- Inverter efficiency. We use a standard efficiency curve scaled to the inverter’s rated efficiency, while PVsyst uses the measured curves from the inverter’s OND file. That makes us 0.4 to 1.2 points more conservative on most projects.
- After the inverter. AC cabling to the grid and the inverter’s night consumption, about 0.5 %, are not in our engine yet, so we compare at the inverter output.
All nine reference projects at glance
Each project was built around one site condition. The line that stands out is PVsyst’s value; the last column is how far our inverter output is from PVsyst’s.
| Country | Built to test | Line that stands out | Simulations | Our output vs PVsyst |
|---|---|---|---|---|
| Belgium | Flat terrain | Temperature −4.3 % | 2 | −0.4 % |
| Switzerland | High horizon | Far shading −38.0 % | 2 | −1.1 % to −0.9 % |
| Norway | Arctic circle | Tilt gain +30.3 % at 45° | 3 | −0.9 % to −0.8 % |
| Ecuador | Equator | Tilt loss −9.1 % at 30° | 6 | −0.6 % to −0.2 % |
| Australia | Temperate zone, southern hemisphere | Tilt gain +19.5 % at 45° | 3 | −0.3 % to −0.2 % |
| Egypt | Desert sun, clipping | Clipping −18.5 % | 2 | +0.1 % to +0.4 % |
| Spain | East-west roof | Temperature −9.7 % | 2 | −0.1 % to 0.0 % |
| Philippines | Tropical heat | Temperature −12.3 % | 1 | −0.3 % |
| Lebanon | High elevation, two inverter sizings | Clipping −12.9 % | 2 | −1.4 % to +1.4 % |
What about PVGIS?
Before this engine, our yield estimates came from PVGIS, the European Commission’s free online solar calculator. PVGIS is an excellent source of solar data, although it uses a simpler yield model. We still use its weather data and terrain horizons.
As a yield model it uses one flat percentage for all system losses (14 % by default), no inverter, and one generic module.
We ran all nine reference projects through PVGIS with its default 14 % loss and the mounting that matches each project (free-standing for ground mounts, building-integrated for roofs), on the same 2023 weather as the PVsyst comparison. PVGIS typically lands 8 to 13 % below PVsyst; our engine stays within 1.4 %.
| Project | PVGIS mounting | PVGIS (kWh/kWp) | Our engine (kWh/kWp) | PVsyst (kWh/kWp) |
|---|---|---|---|---|
| Belgium | Building-integrated | 914 | 1,028 | 1,032 |
| Switzerland, with mountain horizon | Building-integrated | 807 | 779 | 788 |
| Norway, 45° | Free-standing | 752 | 820 | 826 |
| Ecuador, flat | Free-standing | 1,195 | 1,339 | 1,342 |
| Australia, 25° | Free-standing | 1,244 | 1,355 | 1,358 |
| Egypt, 454 kWp on 350 kWac | Free-standing | 1,943 | 2,101 | 2,100 |
| Egypt, 605 kWp on 350 kWac | Free-standing | 1,943 | 1,783 | 1,777 |
| Spain, east-west roof | Building-integrated | 1,357 | 1,554 | 1,553 |
| Philippines | Building-integrated | 1,274 | 1,385 | 1,389 |
| Lebanon | Building-integrated | 1,536 | 1,720 | 1,744 |
PVGIS comes out lower on every project but two, for the three reasons below. The oversized Egyptian design is one exception, because PVGIS never caps the inverter output. Switzerland is the other: PVGIS’s horizon blocks the direct sun but hardly any of the diffuse light, although the mountains hide a large part of the sky. Our engine and PVsyst take that into account and lose 36 % of the diffuse light there.
Three things explain most of the gap:
- One loss for everything. PVGIS calculates reflection, temperature and weak light itself, then takes one flat percentage off the result for everything else: soiling, cabling, mismatch, ageing and the inverter. Our previous version always used its default of 14 %. For these projects those items add up to 6 to 10 % in our engine, so a flat 14 % undersells most sites. It also cannot follow the site: a cold Norwegian roof and a hot Philippine one get the same percentage.
- No inverter. PVGIS gives both Egyptian designs the same yield per kWp, because it never caps the output. With 605 kWp on 350 kWac it ends up above PVsyst, while the well-sized design lands 8 % below.
- One generic module. PVGIS does not know which module you install. It calculates with one generic crystalline-silicon module. The hotter the site, the more that matters: in Egypt PVGIS loses about 11 % to temperature and weak light, our engine about 6 % with the actual module.
PVGIS remains a good first estimate. When a design decision hangs on a few percent, the full loss chain is what makes the difference.
Frequently asked questions
Do I need PAN and OND files?
No. Datasheet values are enough to run a yield. If you have the PAN file of the module and the OND file of the inverter, upload them: the engine reads the full module model and the inverter’s limits from them, which brings the result closer to PVsyst.
Which weather data do you use?
PVGIS (SARAH-3 and ERA5) for most of the world, NSRDB for the United States, or Meteonorm. You can also upload your own weather file (EPW, TMY3 or PVGIS format).
How long does a simulation take?
About one second for a full year of hourly data.
Can I mix orientations on one roof?
Yes. Each group of panels has its own tilt and direction and gets its own loss chain; the plant result adds them up. Our Spanish reference project is an east-west roof simulated this way.
Does it work for thin-film modules?
Yes. CdTe and CIGS modules get a spectral correction, CdTe modules also an electrical model suited to thin film, and technologies without light-induced degradation are not given any.
Why is the result not exactly the same as PVsyst?
Two tools never are. The light and DC side agree within 0.3 %; the difference that remains comes from the inverter efficiency model and from the AC losses after the inverter, which we do not model yet. On the same weather, our inverter output stays within 1.4 % of PVsyst on every reference project.
See it on your own project
Every yield we calculate comes with the full loss chain, so you can see which line your site depends on before you commit to a design. Draw your layout, pick your modules and inverters, and get the same breakdown you have seen here for Switzerland, Norway or Egypt.