

Which shading losses most affect PV layout accuracy?
The shading losses that most affect PV layout accuracy are inter-row shading, near-object shading from rooftop equipment or parapets, and far-horizon shading from terrain or distant buildings. Each one reduces irradiance on modules, and each one interacts with the electrical layout through string mismatch.
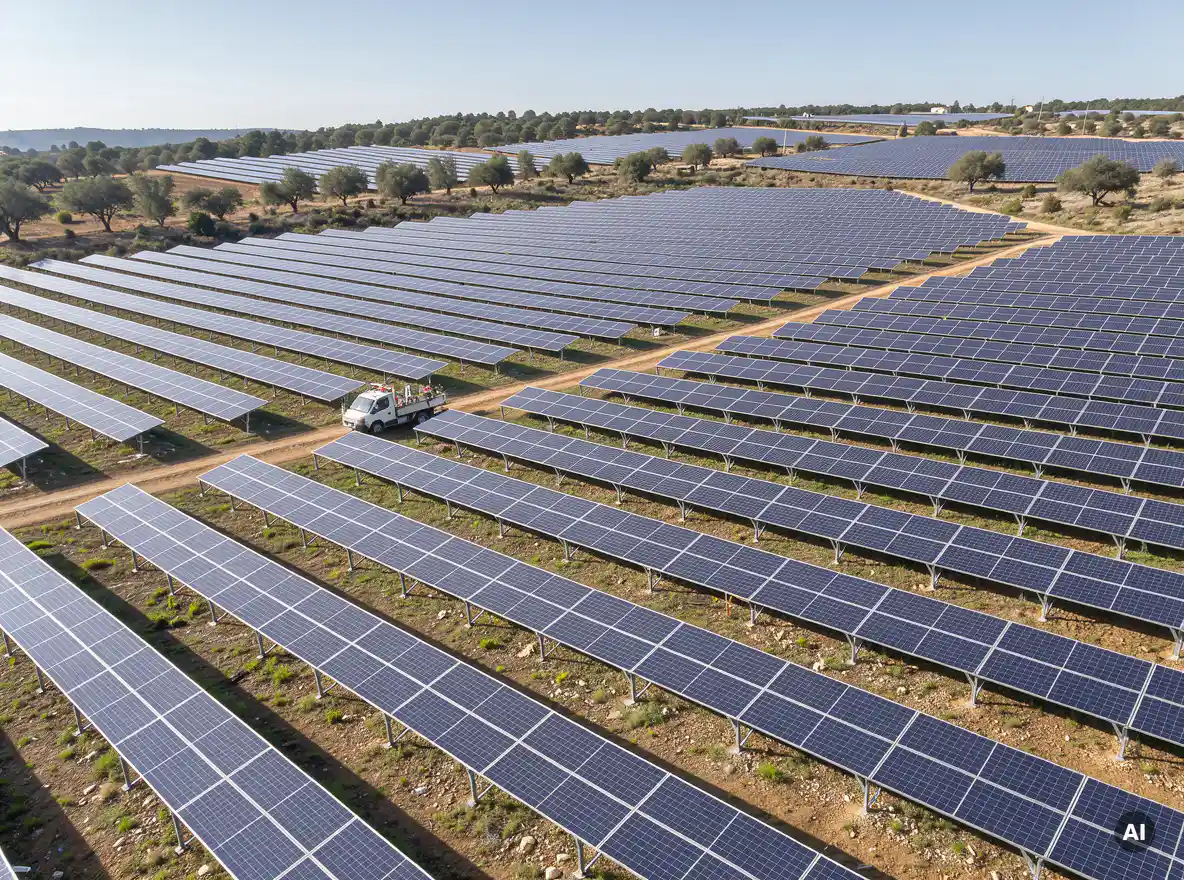
Inter-row shading is the one engineers control most directly, because it depends on tilt, pitch, and row spacing. Near objects such as HVAC units, vent stacks, parapet walls, and trees create irregular shadow patterns that move through the day and across the seasons. Far shading from hills or tall structures mostly trims the sunrise and sunset hours.
The key point for layout accuracy is that shading loss is not just lost irradiance. Because modules in a string share current, a shadow on a single module can pull down the output of the whole string. A layout that ignores this electrical effect will overstate yield, even when the irradiance loss looks small on paper.
How does shading analysis change row spacing and tilt decisions?
Shading analysis changes row spacing and tilt decisions by showing the exact energy trade-off between packing more modules into the available area and losing output to inter-row shadows. Instead of applying a rule-of-thumb spacing, engineers can test several combinations and pick the one that maximizes yield or return.
A steeper tilt generally boosts production per module but casts longer shadows, which forces wider spacing and fewer modules on the same roof or field. A lower tilt allows tighter rows, which is why many flat-roof commercial layouts use low-tilt or east-west arrangements. The right answer depends on site latitude, available area, wind and ballast limits, and the value of each extra kWp.
Running the analysis for several scenarios makes the decision concrete. You can compare, for example, a tighter pitch with higher shading losses against a wider pitch with fewer modules, and see which delivers better yield per square meter or per euro invested. Many teams also check the winter solstice shadow length as a design reference point, then refine from there with full-year simulation.
How does shading affect string and inverter configuration?
Shading affects string and inverter configuration because modules wired in series are limited by the lowest-performing module in the string. Grouping shaded and unshaded modules together causes mismatch losses, so shading analysis guides which modules belong in the same string and on the same MPPT input.
In practice, this leads to a few concrete design choices:
- String grouping: Modules with similar shading profiles go in the same string, so one shaded corner does not drag down a string that is otherwise in full sun.
- MPPT allocation: Heavily shaded strings can be assigned to separate MPPT inputs, so they do not pull down the operating point of unshaded strings.
- Orientation of modules: Landscape or portrait placement changes how bypass diodes react when a shadow crosses a module, which affects how much power survives.
- Optimizers or module-level electronics: Where shading is unavoidable and variable, module-level power electronics can recover part of the mismatch loss.
This is also where the DC/AC ratio gets tested. Shading changes the real power curve, so an inverter sized against an unshaded assumption may clip less, or more, than expected.
What is the difference between near and far shading analysis?
The key difference is distance and modeling approach. Near shading analysis covers objects close to the array, such as parapets, chimneys, adjacent rows, and nearby trees, and is modeled in 3D with moving shadows. Far shading covers the distant horizon, such as hills or tall buildings, and is modeled as a horizon profile.
Near shading
Near objects cast shadows that fall partially on the array and change shape through the day. Because only part of a module or string may be covered, near shading produces the electrical mismatch effects discussed above. It needs a 3D representation of the site and the array to calculate shaded fractions accurately.
Far shading
Far objects block the sun along the horizon line. Their effect is usually all or nothing: when the sun drops behind the ridge or the tall building, the whole array loses direct irradiance at once. Far shading is described with a horizon profile and mostly affects early morning and late afternoon production, with seasonal variation.
For an accurate solar panel layout design, you need both. Treating far shading with a horizon file and near shading with a 3D scene gives the most realistic annual yield estimate.
How accurate is manual shading analysis compared to automated tools?
Manual shading analysis is accurate enough for rough feasibility checks but struggles with complex sites, because it relies on simplified sun-path charts, hand-measured obstacle heights, and a limited number of time steps. Automated tools calculate shading across the full year at fine time resolution and apply it consistently to every module.
The weak point of manual work is not the math itself. It is the repetition. Every change to tilt, pitch, module type, or obstacle position means redoing calculations and updating spreadsheets, which raises the risk of version errors. Engineers who handle commercial and utility-scale projects often find that the manual approach limits how many layout options they can realistically test.
Automated tools remove that bottleneck. With Virto.CAD, we built shading analysis directly into the AutoCAD and BricsCAD environment, so layout changes update the shading results without a separate round of rework. That means more design variants tested in less time, and fewer calculation errors reaching the final drawings.
How can shading results be validated before construction?
Shading results can be validated before construction by cross-checking the model inputs against survey data, comparing outputs with an independent simulation, and reviewing the results against site photos or horizon measurements. The goal is to confirm that the model reflects the real site, not just that the software ran without errors.
A practical validation checklist looks like this:
- Verify obstacle data: Confirm heights, positions, and dimensions of parapets, equipment, and trees against drone surveys, drawings, or site measurements.
- Check the horizon profile: Compare the modeled horizon with on-site measurements or satellite-derived data.
- Cross-check with a simulation tool: Export the layout and compare shading loss and annual yield in a tool such as PVsyst, which many teams use as an independent benchmark.
- Review shadow snapshots: Look at shadow images at key times, such as winter solstice morning and afternoon, and confirm they match what you would expect on site.
- Sanity check the loss figures: If the annual shading loss looks unusually low or high for the site, trace it back to the inputs before trusting it.
Catching a wrong obstacle height at this stage costs minutes. Catching it after procurement or installation costs far more, so validation is worth building into the standard design review.
If you want to see how automated shading analysis fits into your own design workflow, you are welcome to get in touch with us, and we will gladly walk you through it.
Frequently Asked Questions
Where should I start if I want to add shading analysis to my PV design workflow?
Start by collecting reliable site data: a 3D or CAD model of the roof or terrain, obstacle heights (parapets, HVAC units, trees), and a horizon profile. Then run a baseline shading analysis on your initial layout before you lock in module placement and wiring. Once you have a baseline, test two or three alternative tilt and pitch combinations so you can compare shading loss against module count, and carry the winning option forward into string design.
What are the most common mistakes engineers make when running a shading analysis?
The most frequent mistakes are using inaccurate obstacle heights, ignoring small near objects like vent stacks or roof-edge railings, and treating shading as pure irradiance loss without modeling the electrical mismatch. Another common error is running the analysis only after strings and inverters are already specified, which leaves little room to act on the results. Always verify inputs against survey data and feed the findings back into the layout early.
What if my site has seasonal shading from deciduous trees?
Model the trees at their worst-case state for the production period that matters most, which is usually full leaf cover in summer, and consider a second scenario with bare branches in winter. If the shading is significant, you can reposition modules away from the shadow path, assign affected modules to a dedicated string or MPPT input, or consider module-level electronics. Also discuss tree trimming with the site owner, since removing the obstruction is sometimes cheaper than designing around it.
When are optimizers or microinverters worth the extra cost compared with smart string design?
They tend to pay off when shading is unavoidable, irregular, and affects only part of the array, such as a roof with scattered chimneys or dormers. If shading is limited to a predictable zone, grouping similarly shaded modules into dedicated strings or MPPT inputs often recovers most of the loss at lower cost. Run your shading analysis for both options and compare the recovered energy against the added hardware cost to see which wins on your site.
How much shading loss is considered acceptable in a PV layout?
There is no universal threshold, because it depends on the project economics and the value of each extra module. Many designers aim to keep annual inter-row shading losses in the low single-digit percentages, but a tighter pitch with higher losses can still deliver better yield per square meter or per euro invested. Use the analysis to compare scenarios on return rather than chasing a fixed loss target.
Should I update the shading analysis when the layout changes late in the project?
Yes. Any change to tilt, pitch, module type, obstacle position, or string grouping can alter shading patterns and mismatch losses, so the analysis should be rerun before drawings and yield reports are finalized. Using a tool that updates shading results automatically as the layout changes makes this practical, and it prevents outdated loss figures from reaching the final documentation.
How do I know if my shading results are trustworthy enough for financing or client reports?
Back the results with documented inputs: survey-verified obstacle dimensions, a checked horizon profile, and shadow snapshots at key times like the winter solstice. An independent cross-check in a tool such as PVsyst adds credibility, especially for lenders and technical advisors. Keep a short record of assumptions and validation steps so reviewers can trace any loss figure back to its source.